ACST107S データシートの表示(PDF) - STMicroelectronics
部品番号
コンポーネント説明
メーカー
ACST107S Datasheet PDF : 12 Pages
| |||
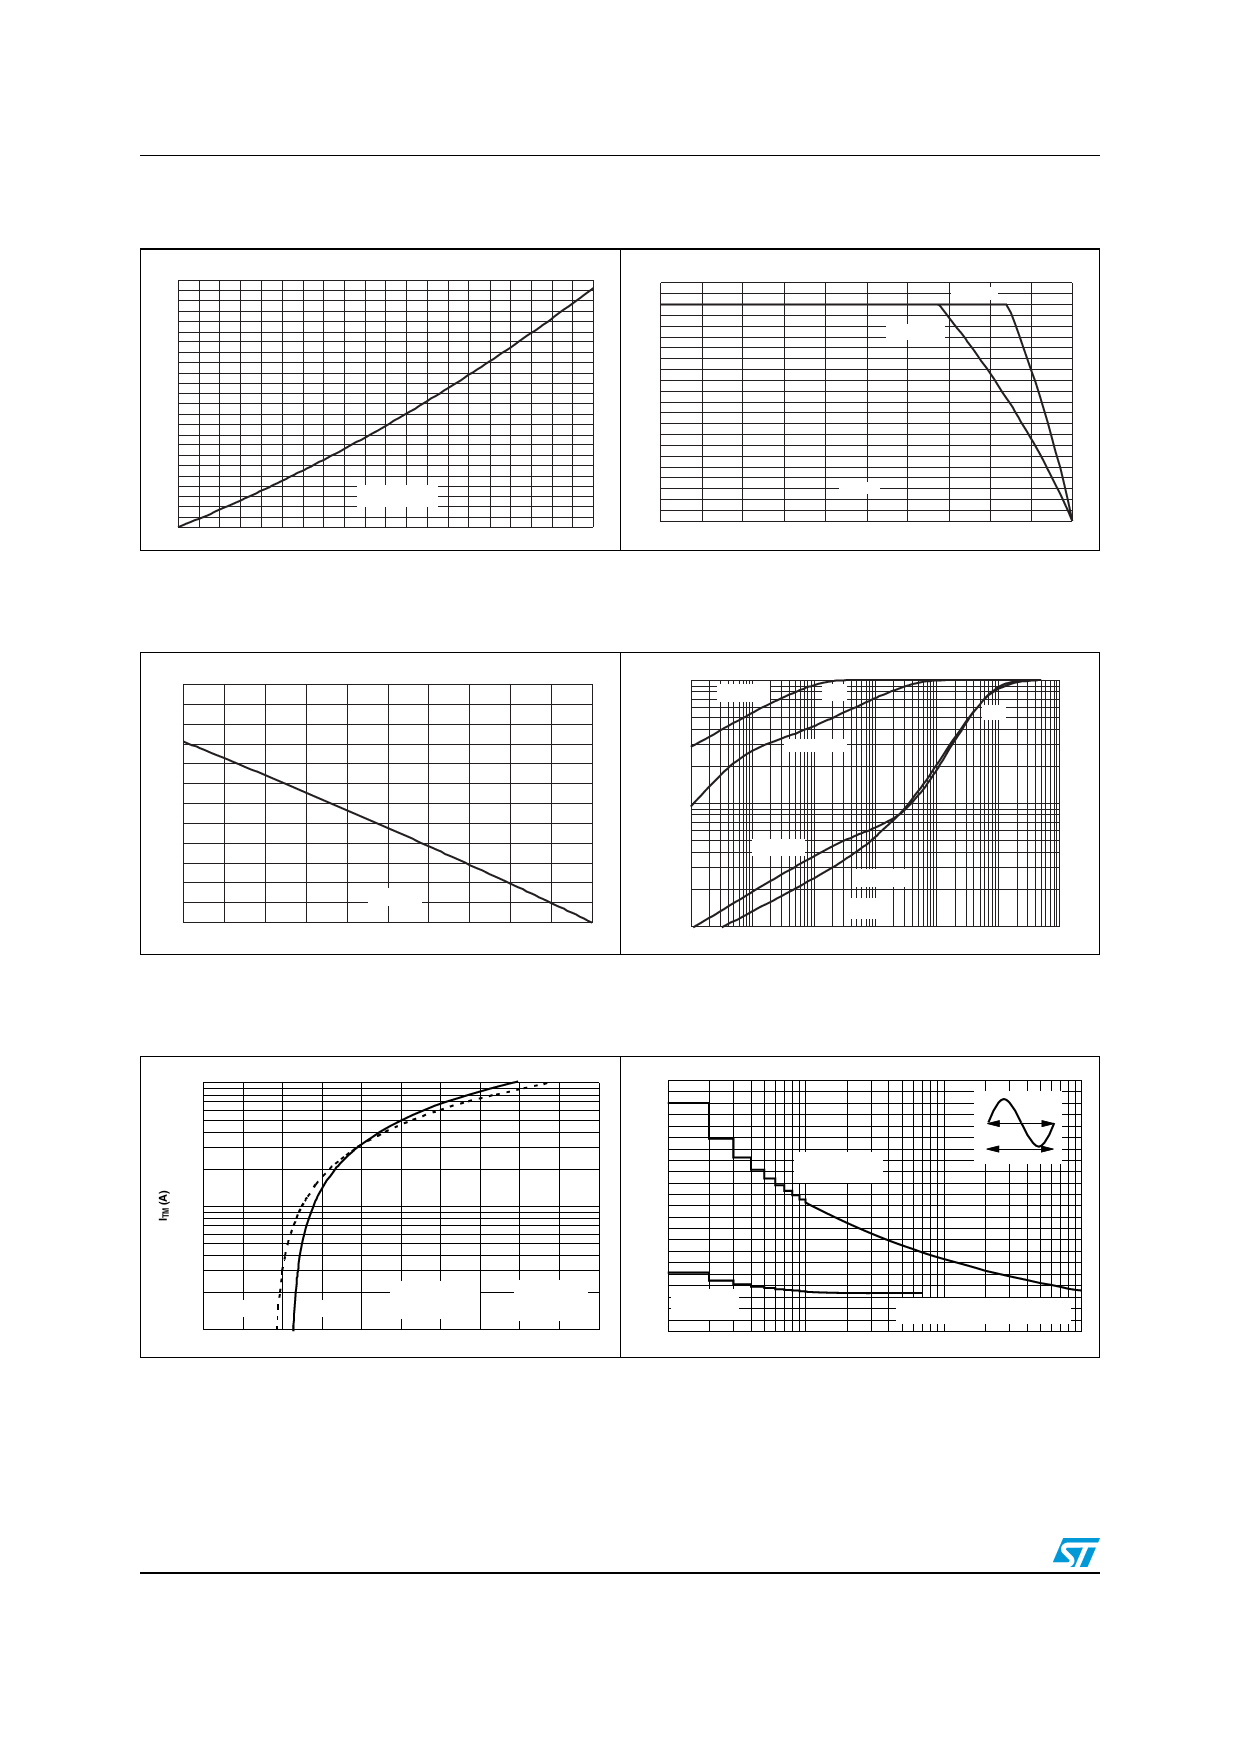
Characteristics
ACST10
Figure 2. Maximum power dissipation vs.
rms on-state current (full cycle)
Figure 3. On-state rms current vs. case
temperature (full cycle)
P(W)
12
11
10
9
8
7
6
5
4
3
2
IT(RMS)(A)
1
0
0
1
2
3
4
5
6
7
8
9
10
IT(RMS)(A)
11
10
9
8
7
6
5
4
3
2
1
0
0
25
TO-220AB
TO-220FPAB
TC(°C)
50
75
100
125
Figure 4.
On-state rms current vs. ambient Figure 5.
temperature (free air convection full
cycle)
Relative variation of thermal
impedance vs. pulse duration
IT(RMS)(A)
3,0
2,5
2,0
K=[Z /R ]
th th
1.0E+00
TO-220AB
Zth(j-c)
TO-220FPAB
Zth(j-a)
1,5
1.0E-01
1,0
TO-220AB
0,5
TO-220FPAB
Tamb(°C)
tp(s)
0,0
1.0E-02
0
25
50
75
100
125
1.0E-03 1.0E-02 1.0E-01 1.0E+00 1.0E+01 1.0E+02 1.0E+03
Figure 6. On-state characteristics
(maximal values)
ITM(A)
100
10
Tj=125 °C
1
0
1
Tj=25 °C
2
VTM(V)
3
Tj max :
Vto = 0.90 V
Rd = 35 mΩ
4
5
Figure 7. Non repetitive surge peak on-state
current vs. number of cycles
(Tj initial = 25 °C)
ITSM(A)
110
100
90
t=20ms
80
Non repetitive
One cycle
70
Tj initial=25 °C
60
50
40
30
20
Repetitive
10 TC=105 °C
0
1
10
Number of cycles
100
4/12
Share Link: 