LTC1282(Rev0) データシートの表示(PDF) - Linear Technology
部品番号
コンポーネント説明
メーカー
LTC1282 Datasheet PDF : 24 Pages
| |||
LTC1282
APPLICATI S I FOR ATIO
DYNAMIC PERFORMANCE
The LTC1282 has exceptionally high speed sampling capa-
bility. FFT (Fast Fourier Transform) test techniques are
used to characterize the ADC’s frequency response, distor-
tion and noise at the rated throughput. By applying a low
distortion sine wave and analyzing the digital output using
an FFT algorithm, the ADC’s spectral content can be
examined for frequencies outside the fundamental. Figure
2 shows a typical LTC1282 FFT plot.
Signal-to-(Noise + Distortion) Ratio
The Signal-to-Noise plus Distortion Ratio [S/(N + D)] is the
ratio between the RMS amplitude of the fundamental input
frequency to the RMS amplitude of all other frequency
components at the A/D output. The output is band limited
to frequencies from above DC and below half the sampling
frequency. Figure 2 shows a typical LTC1282 FFT plot.
0
fSAMPLE = 160kHz
– 20
VDD = 3V
UNIPOLAR
– 40
– 60
– 80
– 100
– 120
0 10 20 30 40 50 60 70 80
FREQUENCY (kHz)
LTC1282 • F07
Figure 2. LTC1282 Nonaveraged, 1024 Point FFT Plot
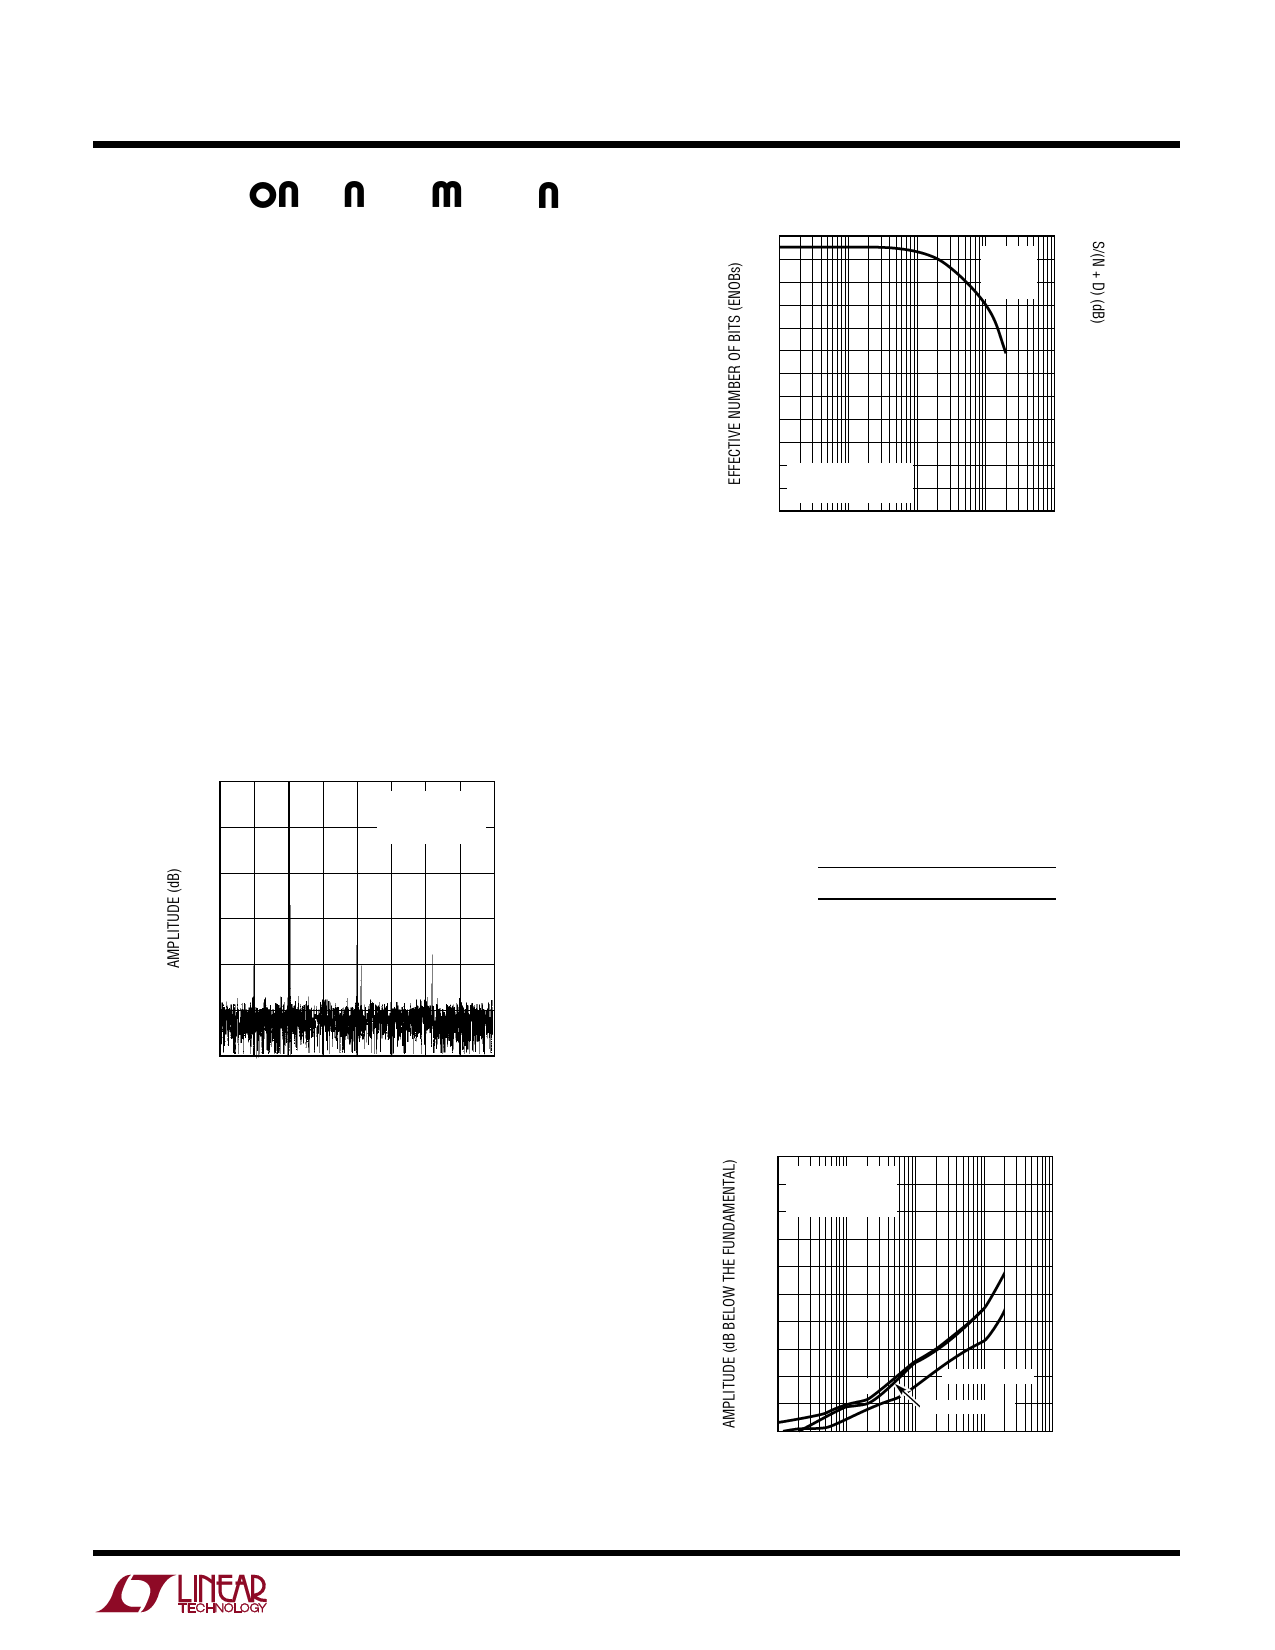
Effective Number of Bits
The Effective Number of Bits (ENOBs) is a measurement of
the resolution of an ADC and is directly related to
S/(N + D) by the equation:
N = [S/(N + D) – 1.76]/6.02
where N is the Effective Number of Bits of resolution and
S/(N + D) is expressed in dB. At the maximum sampling
rate of 140kHz the LTC1282 maintains 11.3 ENOBs at
70kHz input frequency. Refer to Figure 3.
12
74
11
BIPOLAR 68
(± 1.25V
10
INPUT)
62
9
56
8
50
7
6
5
4
3
2 fSAMPLE = 160kHz
1 VS = ±2.7V BIPOLAR
0
1k
10k
100k
1M
10M
INPUT FREQUENCY (Hz)
LTC1282 • F03
Figure 3. ENOBs and S/(N + D) vs Input Frequency
Total Harmonic Distortion
Total Harmonic Distortion (THD) is the ratio of the RMS
sum of all harmonics of the input signal to the fundamental
itself. The out-of-band harmonics alias into the frequency
band between DC and half the sampling frequency. THD is
expressed as:
THD
=
20log√V22
+
V32
+ V42
V1
...
+
VN2
where V1 is the RMS amplitude of the fundamental fre-
quency and V2 through VN are the amplitudes of the
second through Nth harmonics. The typical THD specifi-
cation in the Dynamic Accuracy table includes the 2nd
through 5th harmonics. With a 70kHz input signal, the
LTC1282 has a typical – 82dB THD as shown in Figure 4.
0
– 10
fSAMPLE = 140kHz
±3V SUPPLIES
–20 BIPOLAR
– 30
– 40
– 50
– 60
– 70
– 80
– 90
– 100
1k
3rd HARMONIC
THD
2nd HARMONIC
10k
100k
1M
10M
INPUT FREQUENCY (Hz)
LTC1282 • F04
Figure 4. Distortion vs Input Frequency (Bipolar)
11
Share Link: 