LA7391AN View Datasheet(PDF) - SANYO -> Panasonic
Part Name
Description
Manufacturer
LA7391AN Datasheet PDF : 11 Pages
| |||
LA7391AN
Continued from preceding page.
Parameter
VXO oscillation level
REC ACC characteristics
REC ACC killer input level
REC ACC killer output level
Input level for REC ACC
killer return
VXO control sensitivity
REC APC pull-in range
BGP delay time
Symbol Input Output
Conditions
VVXO-R
T37A T19 VIN = standard color bar signal (1 Vp-p),
measure T19 output amplitude (with a FET
probe)
ACCR1
ACCR2
VACCK-ON
T37A
T37A
T37A
T15A
T15A
T15A
VIN = standard color bar signal (1 Vp-p),
input +6 dB chroma signal level only,
measure T15A burst level, and calculate ratio
with VOR-15
VIN = standard color bar signal (1 Vp-p),
input –6 dB chroma signal level only,
measure T15A burst level, and calculate ratio
with VOR-15
VIN = standard color bar signal (1 Vp-p),
lower the chroma signal, and measure the
input burst level at the point where output at
T15A ceases, and calculate the ratio with the
standard input level
VOACCK T37A T15A Use a spectrum analyzer to measure the
output level at T15A in the killer state
described previously; ratio with VOR-15
VACCK-OFF T4A T34A Starting from the killer state described
previously, gradually raise the input chroma
level and measure the input burst level when
output is generated at T15A and calculate the
ratio with the standard input level
SVXO
T37A
T17
T19A
Measure the pin 17 DC voltage when a
standard color bar signal is input
(1 Vp-p)...V0
Measure the frequency at T19A when V0 is
applied to pin 17 from the external power
supply...f1
Measure the frequency at T19A when V0 +
10 mV is applied to pin 17...f2
SVXO =
f2 – f1 Hz/mV
10
∆ fAPC1
∆ fAPC2
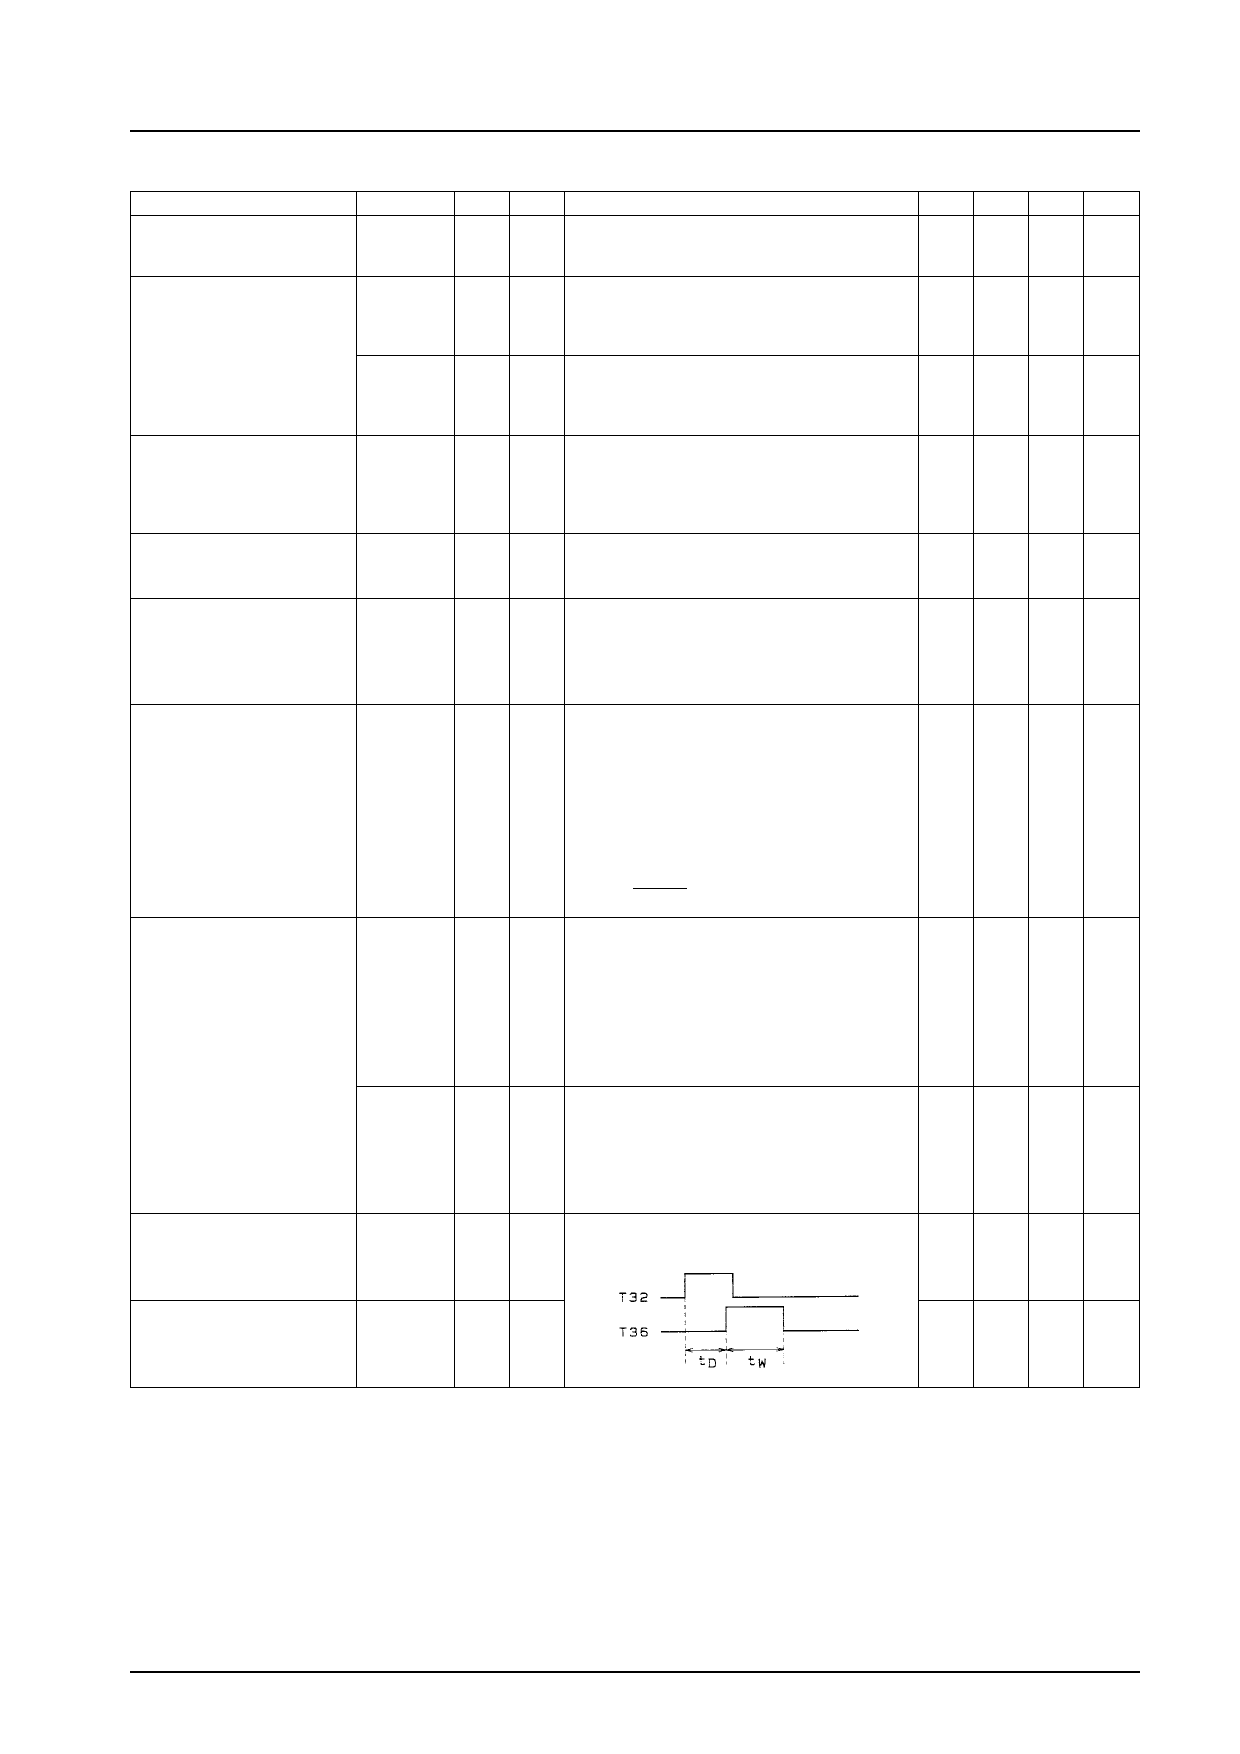
tD
T37A
T37A
T37A
T15A
T15A
T32
T36
Input a 50% white signal overlapped with a
4.4336 MHz, 300 mVp-p continuous wave.
After confirming that there is output at T15A,
increase the frequency of the CW until the
output at T15A stops, and then gradually
reduce the frequency until output appears
again at T15A; that CW frequency is f1.
∆fAPC1 = f1 – 4433619 (Hz)
In the same manner, reduce the frequency of
the CW until the output at T15A stops, and
then gradually increase the frequency until
output appears again at T15A; that CW
frequency is f2.
∆fAPC2 = f2 – 4433619 (Hz)
Measure waveforms at T32 and T36 when a
standard color bar signal (1 Vp-p) is input.
min
450
–0.5
3.8
350
typ
560
0.2
–0.1
–26
–60
–20
5.7
440
–900
4.3
max Unit
670 mVp-p
0.5 dB
dB
dB
–50 dB
dB
7.6 Hz/mV
Hz
–350 Hz
µs
BGP pulse width
tW
T37A T32
T36
4.8
µs
Continued on next page.
No. 3951-5/11
Share Link: 