FSL4110LRN View Datasheet(PDF) - Fairchild Semiconductor
Part Name
Description
Manufacturer
FSL4110LRN Datasheet PDF : 15 Pages
| |||
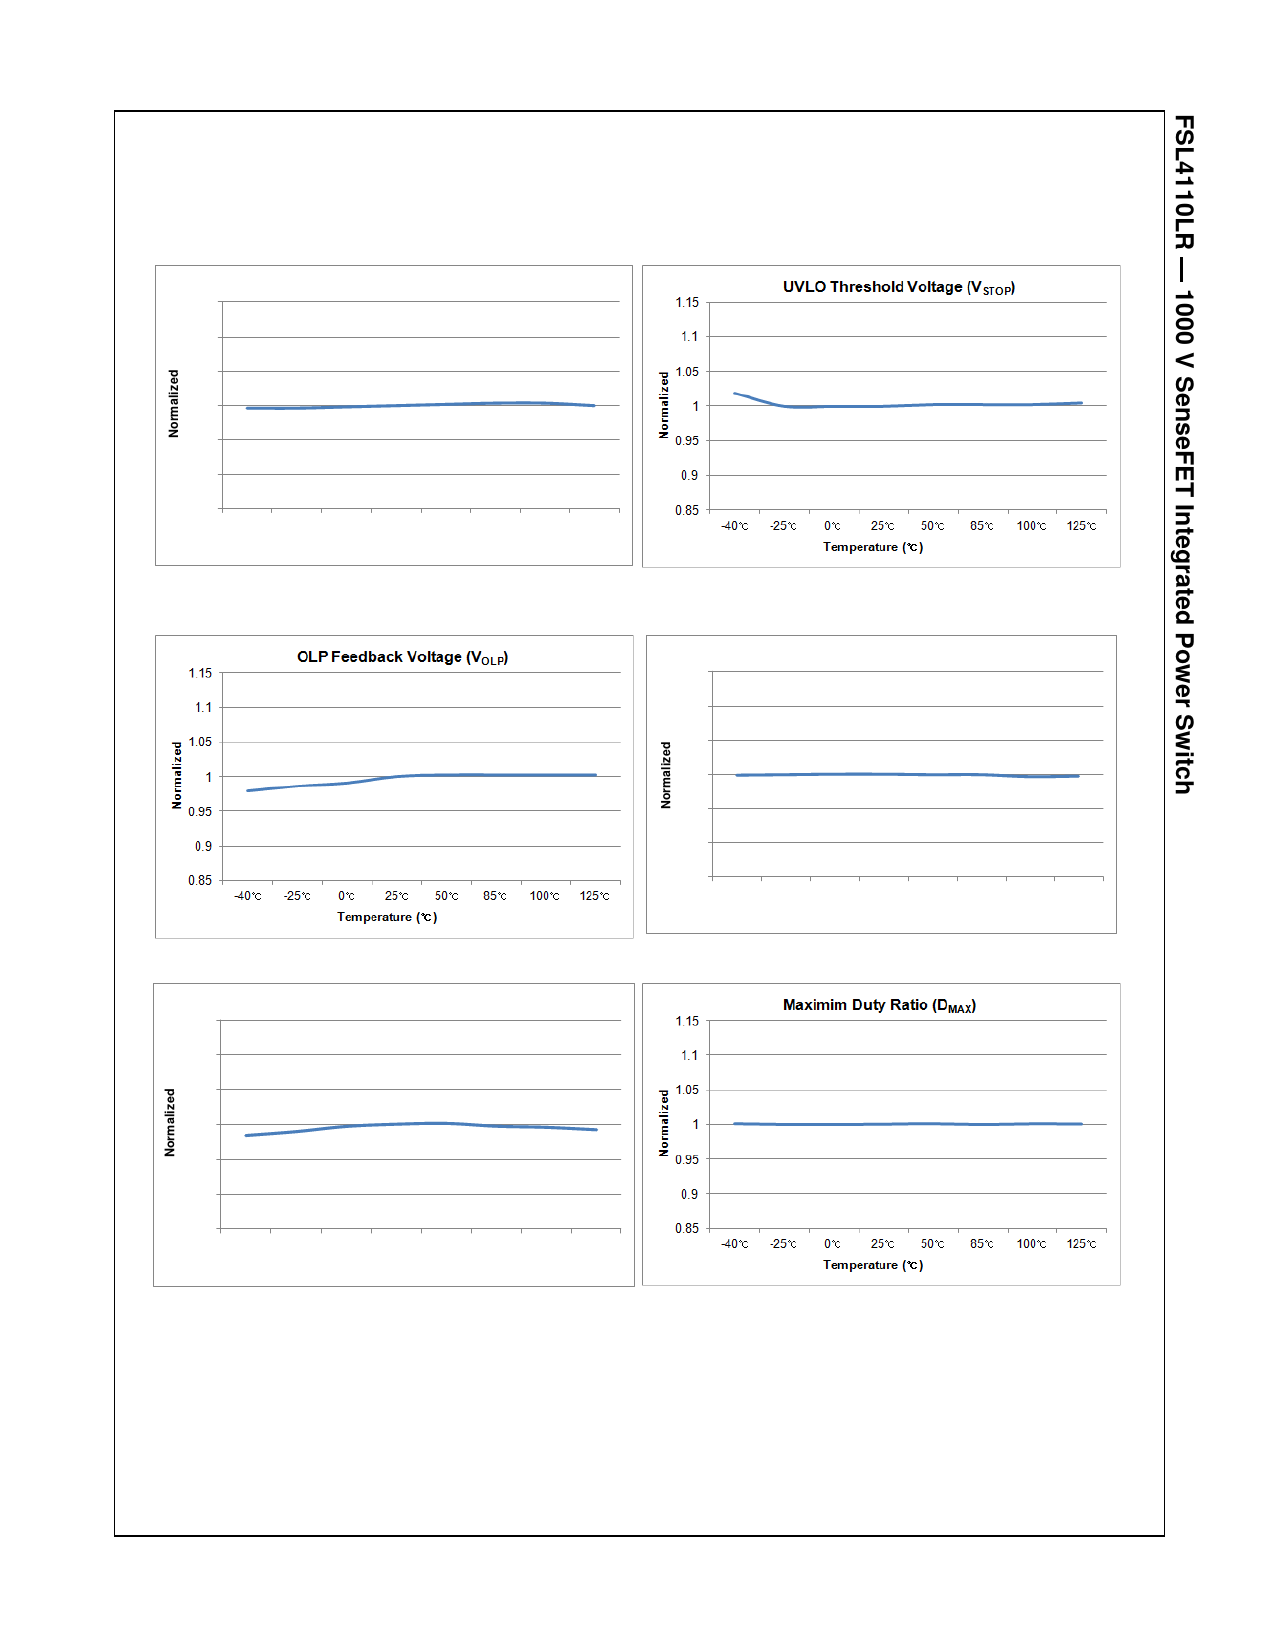
Typical Performance Characteristics (Continued)
Characteristic graphs are normalized at TA=25°C.
UVLO Threshold Voltage (VSTART)
1.15
1.1
1.05
1
0.95
0.9
0.85
-40℃ -25℃ 0℃
25℃ 50℃ 85℃ 100℃ 125℃
Temperature (℃)
Figure 11. UVLO Threshold Voltage (VSTART) vs.
TA
Figure 13. OLP Feedback Voltage (VOLP) vs. TA
Switching Frequency (fS)
1.15
1.1
1.05
1
0.95
0.9
0.85
-40℃ -25℃ 0℃
25℃ 50℃ 85℃ 100℃ 125℃
Temperature (℃)
Figure 15. Switching Frequency (fS) vs. TA
Figure 12. UVLO Threshold Voltage (VSTOP) vs. TA
Over-Voltage Protection (VOVP)
1.15
1.1
1.05
1
0.95
0.9
0.85
-40℃ -25℃ 0℃ 25℃ 50℃ 85℃ 100℃ 125℃
Temperature (℃)
Figure 14. Over-Voltage Protection (VOVP) vs. TA
Figure 16. Maximum Duty Ratio (DMAX) vs. TA
© 2014 Fairchild Semiconductor Corporation
FSL4110LR • Rev. 1.3
8
www.fairchildsemi.com
Share Link: 