BA2902FVME2 查看數據表(PDF) - ROHM Semiconductor
零件编号
产品描述 (功能)
生产厂家
BA2902FVME2 Datasheet PDF : 30 Pages
| |||
BA2904Yxxx-C, BA2902Yxx-C
Datasheet
●Power Dissipation
Power dissipation (total loss) indicates the power that the IC can consume at Ta=25°C (normal temperature). As the IC
consumes power, it heats up, causing its temperature to be higher than the ambient temperature. The allowable
temperature that the IC can accept is limited. This depends on the circuit configuration, manufacturing process, and
consumable power.
Power dissipation is determined by the allowable temperature within the IC (maximum junction temperature) and the
thermal resistance of the package used (heat dissipation capability). Maximum junction temperature is typically equal to the
maximum storage temperature. The heat generated through the consumption of power by the IC radiates from the mold
resin or lead frame of the package. Thermal resistance, represented by the symbol θja°C/W, indicates this heat dissipation
capability. Similarly, the temperature of an IC inside its package can be estimated by thermal resistance.
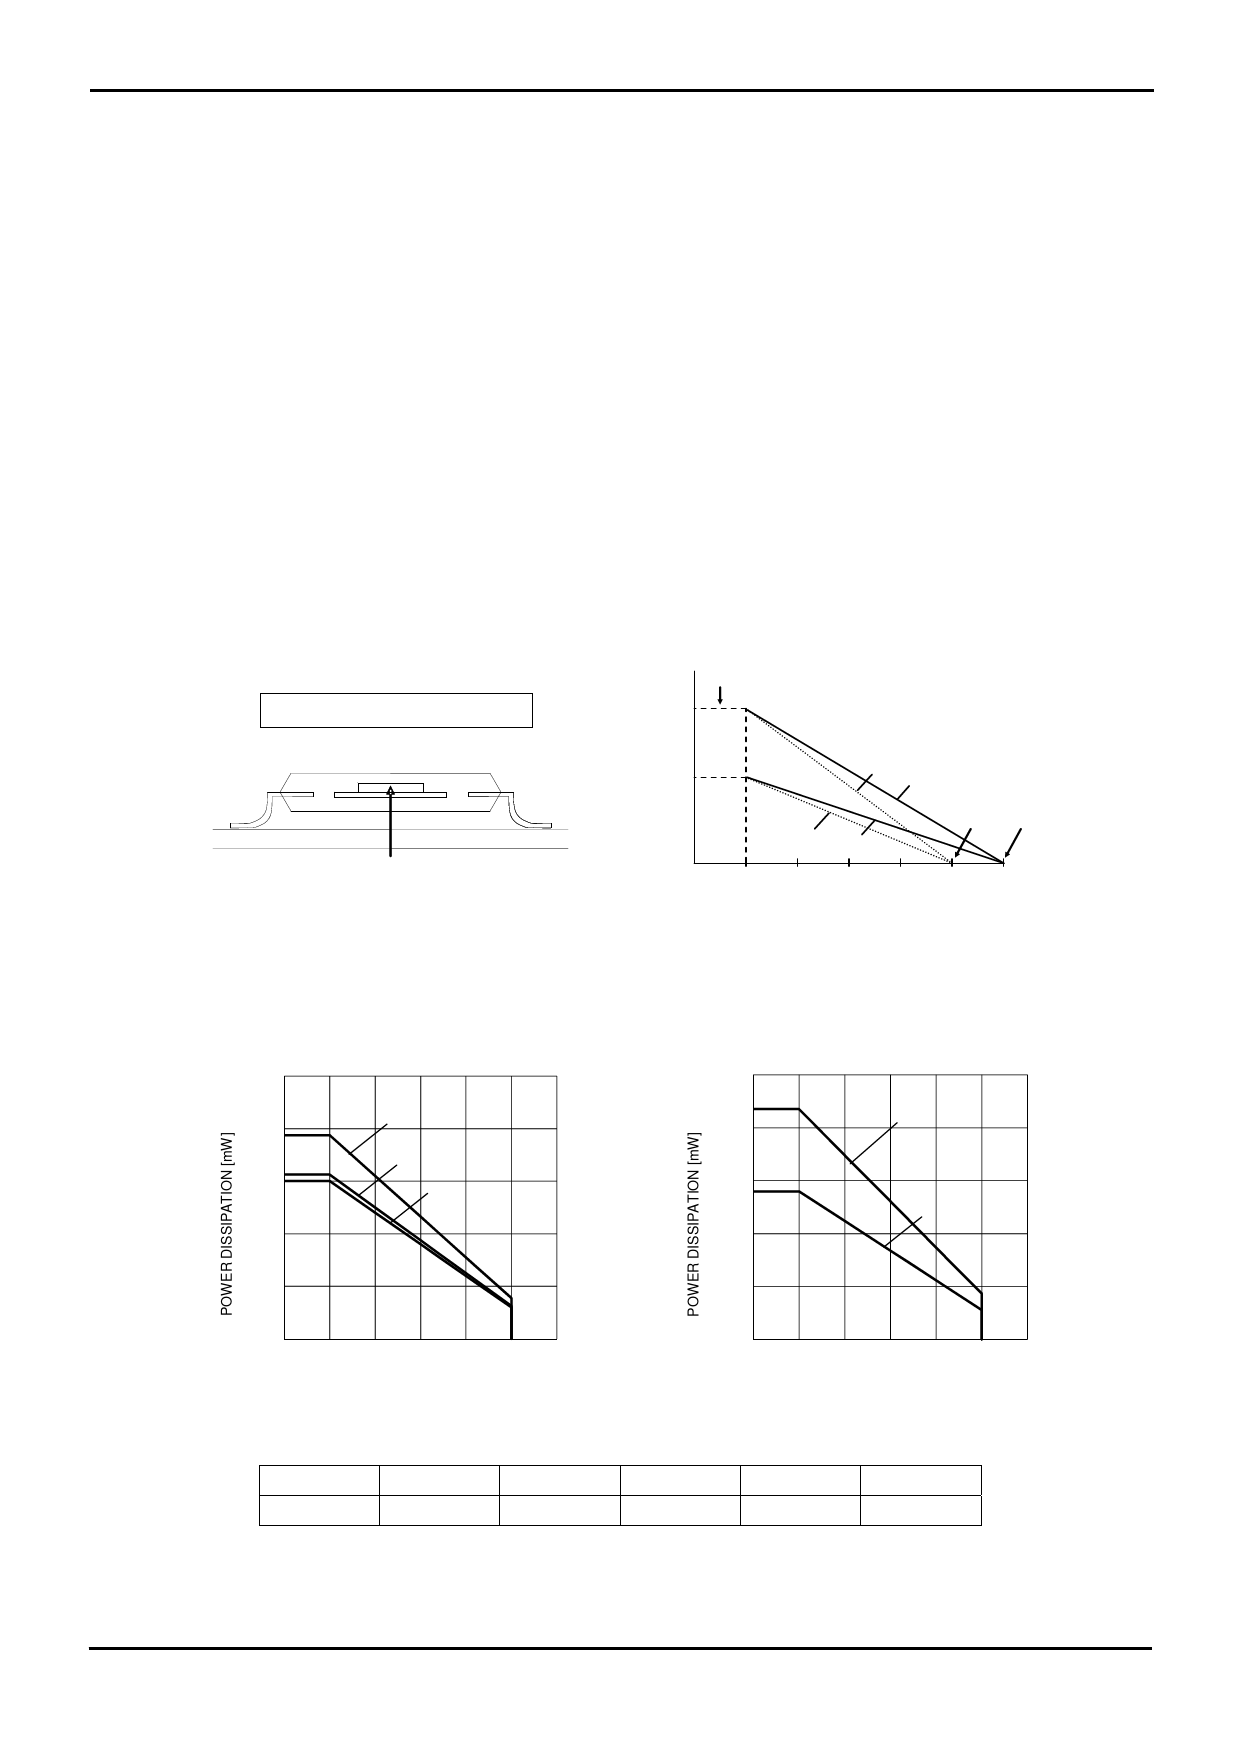
Figure 50. (a) shows the model of the thermal resistance of the package. The equation below shows how to compute for the
Thermal resistance (θja), given the ambient temperature (Ta), junction temperature (Tj), and power dissipation (Pd).
θja = (Tjmax - Ta) / Pd ℃/W
・・・・・ (Ⅰ)
The Derating curve in Figure 50. (b) indicates the power that the IC can consume with reference to ambient temperature.
Power consumption of the IC begins to attenuate at certain temperatures. This gradient is determined by Thermal
resistance (θja), which depends on the chip size, power consumption, package, ambient temperature, package condition,
wind velocity, etc. This may also vary even when the same of package is used. Thermal reduction curve indicates a
reference value measured at a specified condition. Figure 51. (c),(d) shows an example of the derating curve for
BA2904Yxxx-C, BA2902Yxx-C.
θja = ( Tjmax - Ta) / Pd ℃ /W
Ambient temperature Ta ℃
Power dissLiSpIaのtio消n費of電LS力I [W]
Pd (max)
P2
P1
θja2 < θja1
θ' ja2
θ ja2
Chip surface temperature Tj [℃]
Power dissipation Pd[W]
θ' ja1 θ ja1
Tj ' (max) Tj (max)
0
25
50
75
100 125 150
Ambient tempe周ra囲tu温re度 Ta [℃ ]
(a) Thermal resistance
(b) Derating curve
Figure 50. Thermal resistance and derating
1000
800
600
400
BA2904YF-C(12)
BA2904YFV-C(13)
BA2904YFVM-C(14)
1000
800
600
400
BA2902YFV-C(15)
BA2902YF-C(16)
200
200
0
0 25 50 75 100 125 150
AMBIENT TEMPERATURE [℃]
(c) BA2904Yxxx-C
0
0 25 50 75 100 125 150
AMBIENT TEMPERATURE [℃]
(d) BA2902Yxx-C
(12)
(13)
(14)
(15)
(16)
6.2
5.0
4.8
7.0
4.5
When using the unit above Ta=25℃, subtract the value above per Celsius degree .
Mounted on a FR4 glass epoxy board 70mm×70mm×1.6mm(cooper foil area below 3%)
Unit
mW/℃
Figure 51. Derating curve
www.rohm.com © 2013 ROHM Co., Ltd. All rights reserved.
TSZ22111・15・001
20/27
TSZ02201-0RAR1G200110-1-2
21.Jan.2013 Rev.002
Share Link: 