LTC2360HS6 View Datasheet(PDF) - Linear Technology
Part Name
Description
Manufacturer
LTC2360HS6 Datasheet PDF : 20 Pages
| |||
LTC2360/LTC2361/LTC2362
APPLICATIONS INFORMATION
DC PERFORMANCE
The noise of an ADC can be evaluated in two ways: sig-
nal-to-noise ratio (SNR) in the frequency domain and
histogram in the time domain. The LTC2360/LTC2361/
LTC2362 excel in both. Figure 5 demonstrates that the
LTC2360/LTC2361/LTC2362 have an SNR of over 73dB.
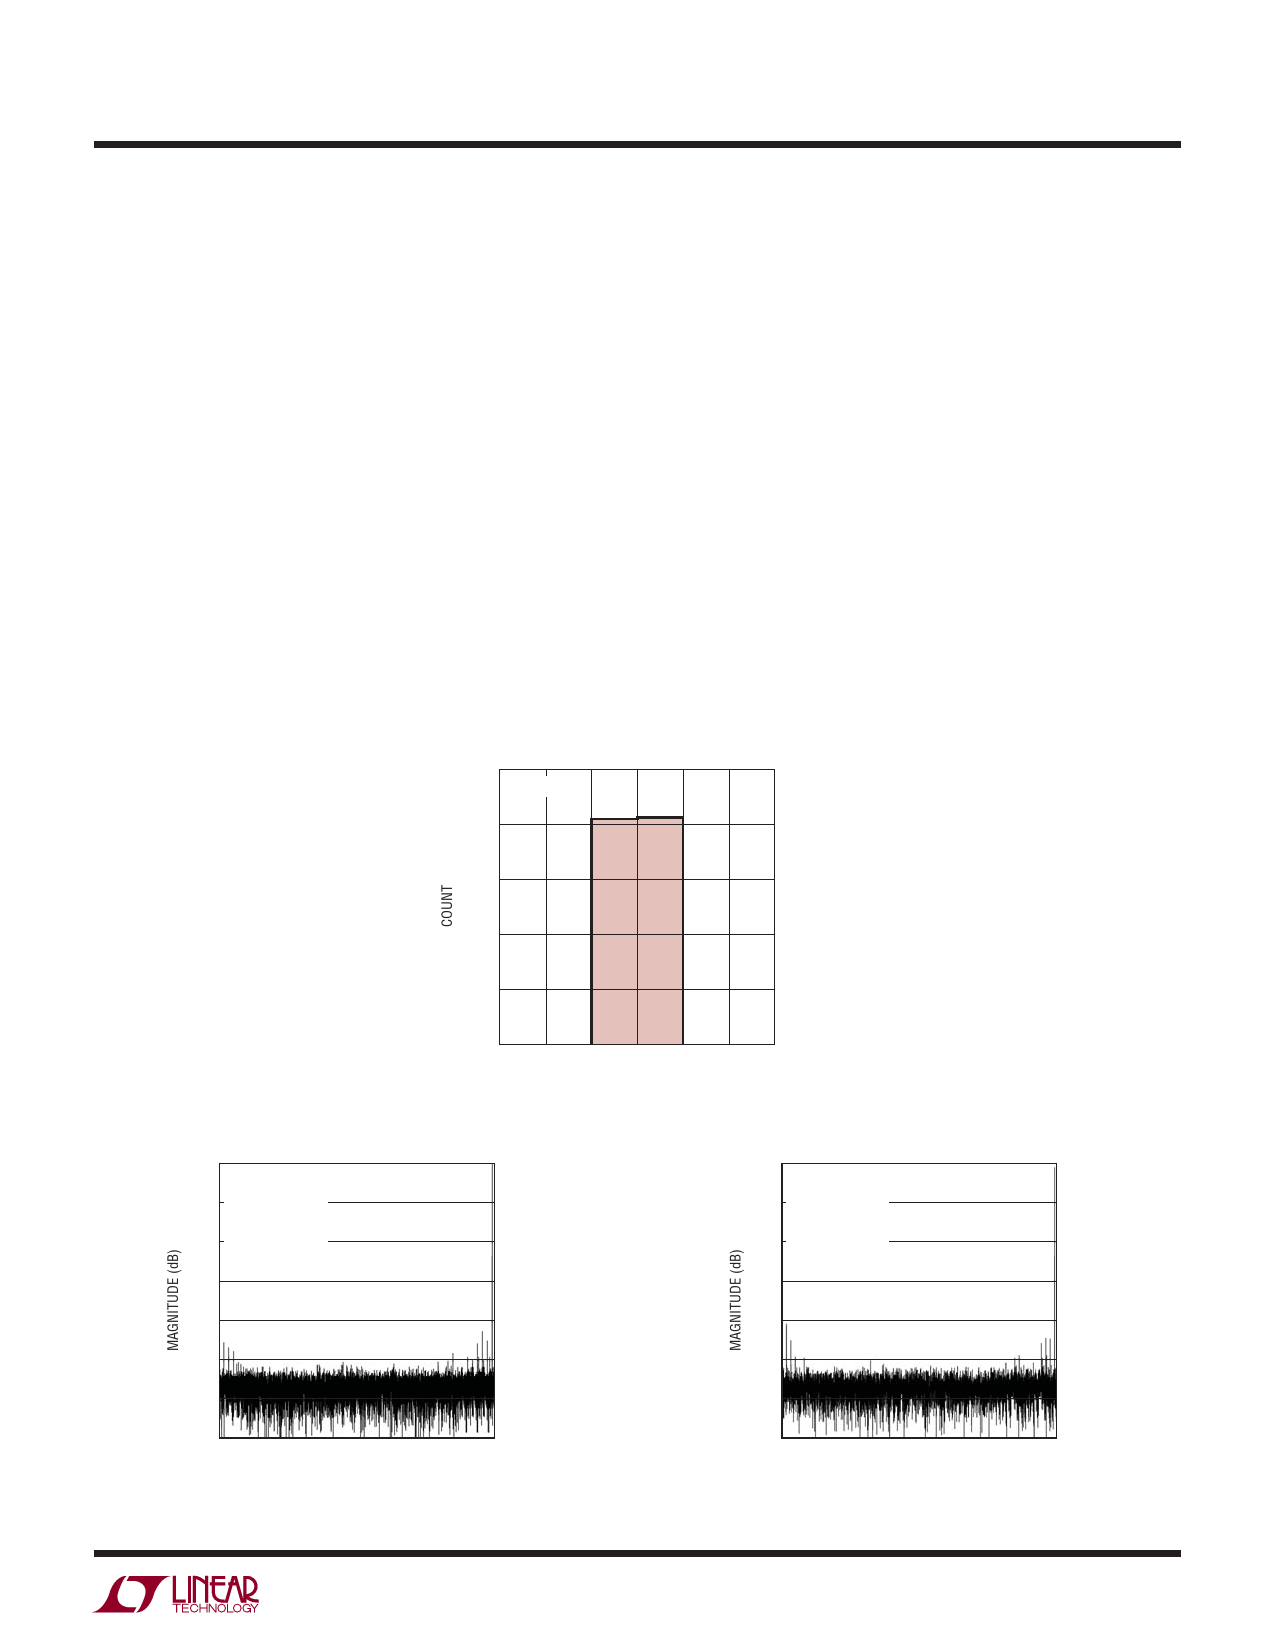
The noise in the time domain histogram is the transition
noise associated with a 12-bit resolution ADC which can
be measured with a fixed DC signal applied to the input of
the ADC. The resulting output codes are collected over a
large number of conversions. The shape of the distribu-
tion of codes will give an indication of the magnitude of
the transition noise. In Figure 4, the distribution of output
codes is shown for a DC input that has been digitized
16384 times. The distribution is Gaussian and the RMS
code transition is about 0.32LSB. This corresponds to a
noise level of 73dB relative to a full scale of 3V.
DYNAMIC PERFORMANCE
The LTC2360/LTC2361/LTC2362 have excellent high speed
sampling capability. Fast fourier transform (FFT) test
techniques are used to test the ADCs’ frequency response,
distortion and noise at the rated throughput. By applying
a low distortion sine wave and analyzing the digital output
using an FFT algorithm, the ADCs’ spectral content can
be examined for frequencies outside the fundamental.
Figures 5 and 6 show typical LTC2361 and LTC2362 FFT
plots respectively.
10000
VDD = 3V
8000
6000
4000
2000
0
2045 2046 2047 2048 2049 2050
CODE
236012 F04
Figure 4. Histogram for 16384 Conversions
0
VDD = 3V
–20
fSMPL = 250ksps
fIN = 124kHz
SINAD = 73dB
–40 THD = –84dB
–60
–80
–100
–120
–140
0
25
50
75 100 125
INPUT FREQUENCY (kHz)
236012 F05
Figure 5. LTC2361 FFT Plot
0
VDD = 3V
–20
fSMPL = 500ksps
fIN = 248kHz
SINAD = 73dB
–40 THD = –81dB
–60
–80
–100
–120
–140
0
50 100 150 200 250
INPUT FREQUENCY (kHz)
236012 F06
Figure 6. LTC2362 FFT Plot
236012fa
11
Share Link: 